Another busy year of HF operation with frequent contacts, often daily. 2021 was more like 2019– mostly FT8 digital mode work but this year I added many states by phone (SSB), whereas 2019 added many CW contacts. Band conditions have been fair most of the year but managed to make quite a few non-FT8 contacts. Solar cycle 25 is showing signs of life with a few good propagation days already in 2021 so signs of hope for 2022 for more phone and CW contacts. Here is the cumulative summary of achievements (2016 thru 2021)…
On the DX front, confirmed countries year over year as follows:
![]() 2021
2021
 2020
2020
The grand total at end of the year is 133 countries with one on 60m that doesn’t count towards DXCC (Cape Verde).
Domestically I added the 12m and 10m bands to Worked All States (WAS) award (confirmed via LoTW on all 50 states), largely digital mode. Stuck at 46 states on 80m since 2018. The state tally of all bands and all modes looks like this, year over year:
 2021
2021
 2020
2020
WAS on 80m remains elusive; I got a better (longer– 63ft) antenna up in 2021, but 80m performance hasn’t been notably better than the older 32ft antenna. That may be due to propagation on lower frequencies being somewhat diminished.
On CW (Morse Code) I have 49 states confirmed on QRZ out of 49 logged (painfully close; need only Alaska):
 2021: 49/49 (+4)
 2020: 45/46 (+5)
2021 was a banner year for phone work where I now have 43 states confirmed in QRZ out of 43 worked:
 2021: 43/43 (+33)
 2020: 10/11 (+1)
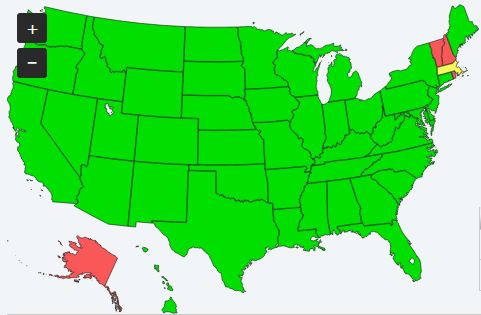
Both maps should improve somewhat next year as I hope to do more CW and phone work in 2022, although there is not much more to do to reach the big long-term goal of working and confirming all 50 states in LoTW to achieve the Triple Play Award (confirmed all states in CW, phone, and Digital modes). At year’s end I have triple play on 43 states, 49 in CW, 43 in SSB, and 50 digital mode (digital mode WAS on 7 bands).
My color-coded LoTW state map shows gray for digital mode only, yellow for digital+CW, and green for all three modes (triple play):
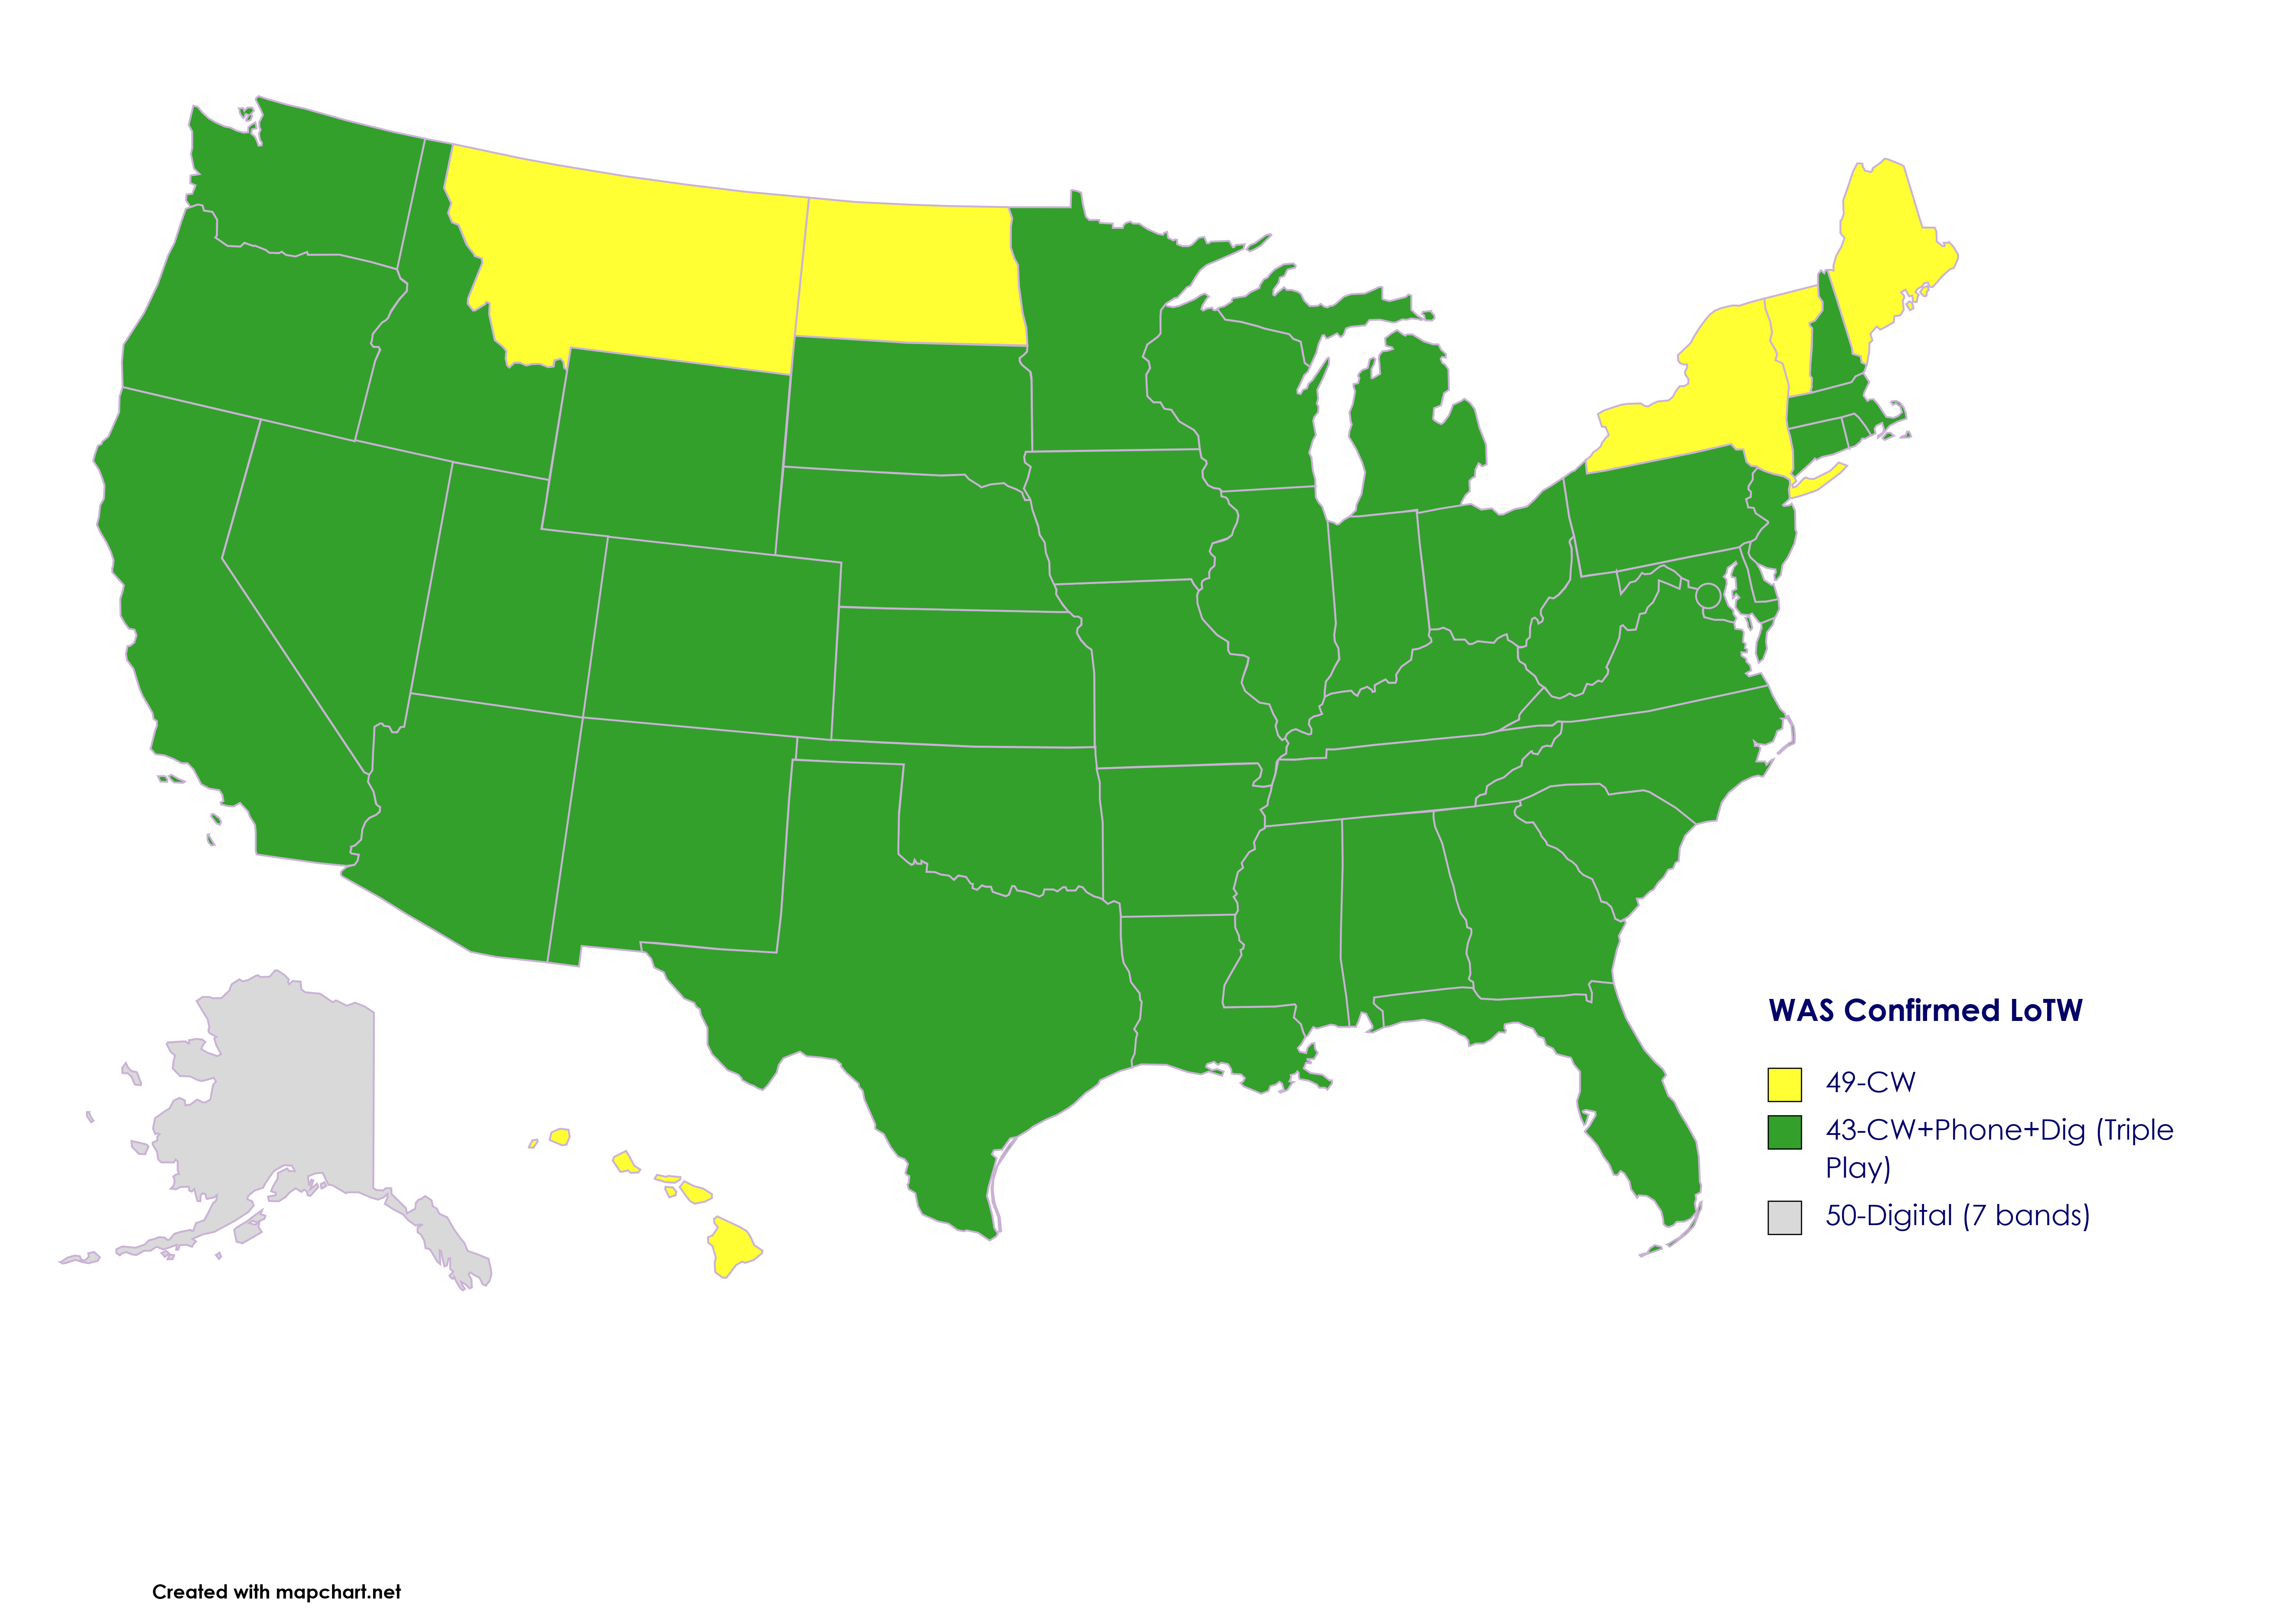
2021 (+33 Triple Play)
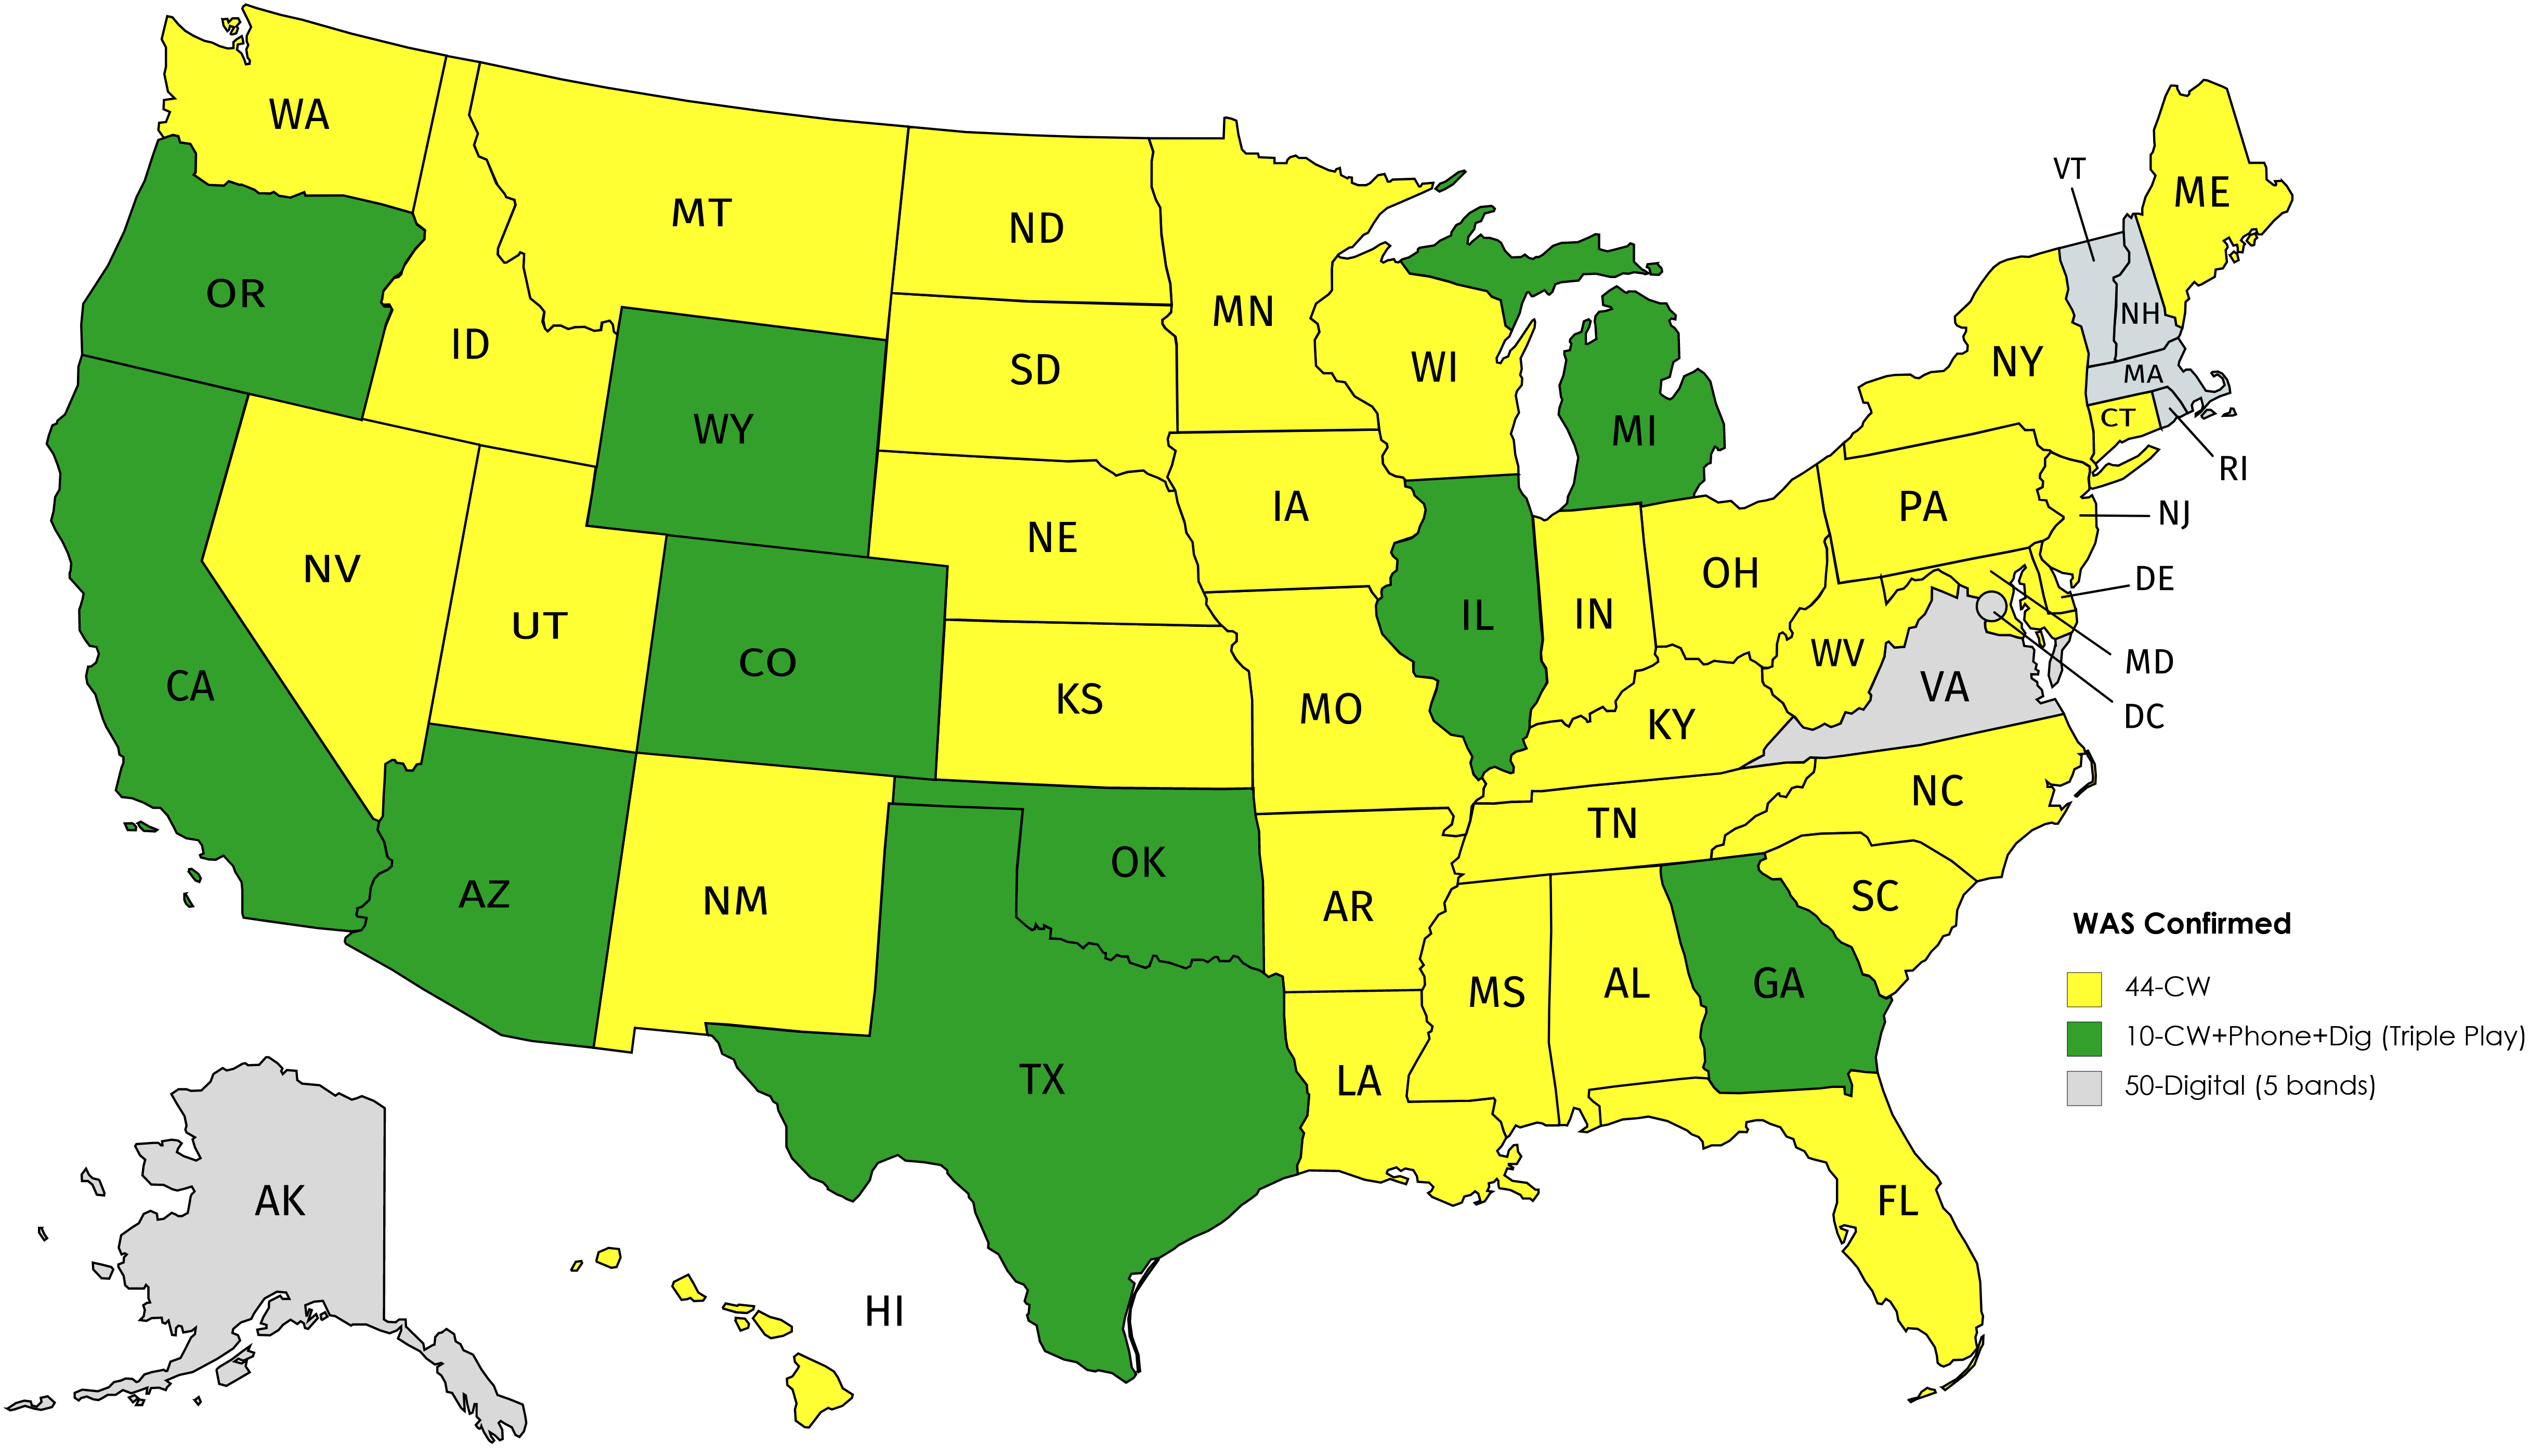
2020 (+2 Triple Play)
Because I made a lot of progress towards Triple Play and because the higher frequencies opened up a bit, I started posting states by band and mode chart on my QRZ page:

2021 was once again good for hunting US counties. My year-end total is 2102 confirmed out of 3137 counties (67.0%). My 2020 tally was 1954/3137 counties (62.3%). Net for 2021 is +148 or 2.846/week on average; this rate will decrease in 2022 as my pool of active remaining counties drops off. +2 states to the list of all counties confirmed to equal 9 (AZ,CT,DE,HI,MA,MD,NJ,NH,RI) with ME in striking distance. CA and VT have one county where there are no HF-active hams who could give QRZ or LoTW QSLs so those two states will remain painfully shy of completion until something changes. FL and LA have one or two counties with no active hams as well so I’m not optimistic about completing them, either.
The percentages are shown below:
| State | Tally | % | Poss | Rem | QRZ | Card | eQSL | LoTW | Total | ||
| Alabama | 51/67 | 76% | 67 | 16 | 51 | 51 | |||||
| Alaska | 8/27 | 30% | 27 | 19 | 8 | 8 | |||||
| Arizona | 15/15 | 100% | 15 | 0 | 15 | 15 | |||||
| Arkansas | 46/75 | 61% | 75 | 29 | 46 | 46 | |||||
| California | 54/58 | 93% | 58 | 4 | 54 | 54 | |||||
| Colorado | 37/64 | 58% | 64 | 27 | 37 | 37 | |||||
| Connecticut | 8/8 | 100% | 8 | 0 | 8 | 8 | |||||
| Delaware | 3/3 | 100% | 3 | 0 | 3 | 3 | |||||
| Florida | 59/67 | 88% | 67 | 8 | 59 | 59 | |||||
| Georgia | 93/159 | 58% | 159 | 66 | 93 | 93 | |||||
| Hawaii | 4/4 | 100% | 4 | 0 | 4 | 4 | |||||
| Idaho | 27/44 | 61% | 44 | 17 | 27 | 27 | |||||
| Illinois | 75/102 | 73% | 102 | 28 | 74 | 1 | 75 | ||||
| Indiana | 70/92 | 76% | 92 | 22 | 70 | 70 | |||||
| Iowa | 55/99 | 56% | 99 | 44 | 55 | 55 | |||||
| Kansas | 49/105 | 47% | 105 | 56 | 49 | 49 | |||||
| Kentucky | 64/120 | 53% | 120 | 56 | 64 | 64 | |||||
| Louisiana | 42/64 | 66% | 64 | 22 | 42 | 42 | |||||
| Maine | 15/16 | 94% | 16 | 1 | 15 | 15 | |||||
| Maryland | 24/24 | 100% | 24 | 0 | 24 | 24 | |||||
| Massachusetts | 14/14 | 100% | 14 | 0 | 14 | 14 | |||||
| Michigan | 66/83 | 80% | 83 | 17 | 66 | 66 | |||||
| Minnesota | 53/87 | 61% | 87 | 34 | 53 | 53 | |||||
| Mississippi | 43/82 | 52% | 82 | 39 | 43 | 43 | |||||
| Missouri | 74/115 | 64% | 115 | 41 | 74 | 74 | |||||
| Montana | 24/56 | 43% | 56 | 32 | 24 | 24 | |||||
| Nebraska | 34/93 | 37% | 93 | 59 | 34 | 34 | |||||
| Nevada | 12/17 | 71% | 17 | 5 | 12 | 12 | |||||
| New Hampshire | 10/10 | 100% | 10 | 0 | 10 | 10 | |||||
| New Jersey | 21/21 | 100% | 21 | 0 | 21 | 21 | |||||
| New Mexico | 25/33 | 76% | 33 | 8 | 25 | 25 | |||||
| New York | 56/62 | 90% | 62 | 6 | 56 | 56 | |||||
| North Carolina | 81/100 | 81% | 100 | 19 | 81 | 81 | |||||
| North Dakota | 25/53 | 45% | 53 | 29 | 24 | 1 | 25 | ||||
| Ohio | 81/88 | 92% | 88 | 7 | 81 | 81 | |||||
| Oklahoma | 52/77 | 68% | 77 | 25 | 52 | 52 | |||||
| Oregon | 30/36 | 83% | 36 | 6 | 30 | 30 | |||||
| Pennsylvania | 62/67 | 93% | 67 | 5 | 62 | 62 | |||||
| Rhode Island | 5/5 | 100% | 5 | 0 | 5 | 5 | |||||
| South Carolina | 32/46 | 70% | 46 | 14 | 32 | 32 | |||||
| South Dakota | 18/66 | 27% | 66 | 48 | 18 | 18 | |||||
| Tennessee | 73/95 | 76% | 95 | 23 | 72 | 1 | 73 | ||||
| Texas | 143/254 | 56% | 254 | 111 | 143 | 143 | |||||
| Utah | 23/29 | 79% | 29 | 6 | 23 | 23 | |||||
| Vermont | 12/14 | 86% | 14 | 2 | 12 | 12 | |||||
| Virginia | 93/132 | 67% | 132 | 43 | 89 | 3 | 1 | 93 | KC2RXS | ||
| Washington | 35/39 | 90% | 39 | 4 | 35 | 35 | |||||
| West Virginia | 34/55 | 62% | 55 | 21 | 34 | 34 | |||||
| Wisconsin | 56/72 | 78% | 72 | 16 | 56 | 56 | |||||
| Wyoming | 16/23 | 70% | 23 | 7 | 16 | 16 | |||||
| Total | 2102/3137 | 67.0% | 3137 | 1042 | 2095 | 5 | 0 | 2 | 0 | 2102 | Total |
| States Completed | 9 | 2102 | |||||||||
| States >50% | 18 | prev count | |||||||||
| States >75% | 17 | ||||||||||
| States <6 | 6 |
At only 27%, SD is my weakest state and is likely to remain so for a long time; not too many hams there. Texas is notable at 143 counties of 254.
My custom color-coded map shows different shades of confirmation: green as confirmed QRZ or LoTW, orange as worked but unconfirmed, purple as confirmed via eQSL, teal as confirmed by card, alt green confirmed by LoTW but not QRZ (location mis-match), and black as home county (confirmed):

2021 (+148x)

2020
